Plotting: thick maps#
This notebook documents how to make maps inside the simulation domain with a non-zero thickness. This is also sometimes called a column density plot, although it generally only applies to gas density, while any quantity can be used in thick maps.
We use the map function to compute a 3D grid of values, and this volume then gets integrated along the third dimension.
Warning
The current implementation generates a 3D grid of points, and for each one of these points, finds the single AMR cell that contains it. It then assigns the value in the AMR cell to the grid point position. The algorithm does not perform a histogramming of all the cells into a 3D cube of bins.
This means that this method is not well suited to the computation of, e.g., surface density maps of a galaxy, where the unit would be in \({\rm M}_{\odot} {\rm pc}^{-2}\), because it does not sum the mass contained in each bin, and results depend on the resolution used. If you wish to make such a plot anyway, you should ensure you are resolution-converged.
[1]:
import osyris
import numpy as np
import matplotlib.pyplot as plt

path = "osyrisdata/starformation"
data = osyris.RamsesDataset(8, path=path).load()
mesh = data["mesh"]
ind = np.argmax(mesh["density"])
center = mesh["position"][ind.values]
Processing 12 files in osyrisdata/starformation/output_00008
 16% : read      65623 cells,          0 particles
 25% : read      90140 cells,        956 particles
 33% : read     118232 cells,        956 particles
 41% : read     147100 cells,        956 particles
 50% : read     170244 cells,       2109 particles
 66% : read     235859 cells,       2109 particles
 75% : read     260384 cells,       3065 particles
 83% : read     288476 cells,       3065 particles
 91% : read     312840 cells,       4217 particles
Loaded: 340488 cells, 4218 particles.
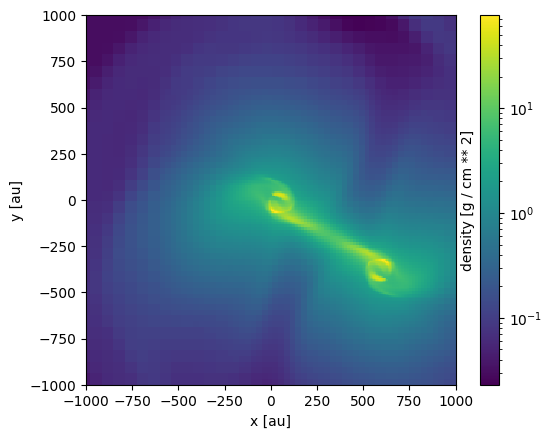
Making a thick slice of gas density#
To make a thick slice, we supply a dz argument to the map function.
[2]:
osyris.map(
    mesh.layer("density"),
    norm="log",
    dx=2000.0 * osyris.units("au"),
    dz=1500.0 * osyris.units("au"),
    origin=center,
    direction="z",
)
[2]:
<osyris.core.plot.Plot at 0x7697417ff4c0>
Resolution#
As described at the top of the notebook, the current implementation of the thick maps means that resolution is an important parameter to consider when making thick maps.
By default, map will try to make the pixel size in the z dimension as close as possible to the pixel sizes in the horizontal and vertical directions. This means that in the case where dx = 2000 AU for 256 pixels, if dz = 1500 AU then the number of pixels in the z dimension will be 192.
This can however manually be changed, using the resolution argument, as follows.
[3]:
osyris.map(
    mesh.layer("density"),
    norm="log",
    dx=2000.0 * osyris.units("au"),
    dz=1500.0 * osyris.units("au"),
    origin=center,
    direction="z",
    resolution={"z": 256},
)
[3]:
<osyris.core.plot.Plot at 0x76973f3c3670>
